Manage Permissions in Data Studio Like a Pro


When you think of data, you get a mental picture of scientists and buttoned-up tech professionals poring over figures and numbers. But that picture is quickly morphing to encompass every decision maker across an organization, increasing data’s value for wider use. At the same time, data volume is rapidly increasing, calling for a need to make it more accessible and easier to understand for everyone whose workflow it touches.
In our work, we’ve found that Google Data Studio does an excellent job with both. A free, online tool that transforms public and private data into interactive knowledge, the platform powerfully visualizes data at teams’ fingertips, without betraying security.
Augmenting Data Visualization with Google Data Studio
Google Data Studio helps people comprehend and manage data. Using the platform, you can:
- Identify business trends: Interact with the data in the form of charts, maps, graphs and tables, using popular features like filters and segments.
- Turn budget data into customized reports: A fully functional Business Intelligence (BI) platform with customizable interactive dashboards and reports.
- Assess the performance of your websites and/or business: By connecting website analytics with business data, you can find outliers in performance.
- Analyze customized data and find useful data points for varied success criteria: Users may manipulate the data to suit their needs, having varying levels of user access.
Furthermore, access permissions can be managed across the whole organization with help from Google Workspace. Dashboard owners can also prevent other users from further sharing a dashboard and limit their options when it comes to downloads or exports to mitigate the risk of unauthorized data sharing.
However, even though the different access levels and sharing controls are intended to prohibit the wrong people accessing sensitive/personal data, the process of sharing a dashboard or restricting access to one can be difficult to manage at scale. Google’s documented solution to personalize data results proposes using more data sources and using the blending functionality to create many-to-many filters. There are scenarios where this can be feasible (especially when BigQuery is not involved), but it could involve making changes to the data source that would then need updating if permissions changed.
Managing Complex and Interconnected Data Streams
It’s easy for data to become overwhelming, and when a dashboard is connected to a data source used by multiple people, the dashboard owner wants to ensure that each user only sees the data that is relevant to them. This becomes an especially important requirement if the data in question is considered sensitive. So, how does one factor in this kind of a requirement in a dashboard using pre-existing Data Studio capabilities?
Using an email filter is one way to restrict access to irrelevant or sensitive data. When this feature is in use, Data Studio searches for the user's email address in the column that carries all user email addresses in the data source, and if located, Data Studio will filter and present only the relevant part of the data for that user. This is designed to provide a higher level of restriction around data that directly relates to an individual, known as “row-level data security.” The feature is available for any data source. If the data is in BigQuery, you can filter by the user's email address using the email parameter in a custom query.
This feature isn’t without caveats, though. By default, the row-level data security function falls short in scenarios when more than one person has access to the same row of data. For example, if we are looking at internal business metrics about an employee in relation to a multilevel organizational structure, there might be an ongoing need for a manager to be able to have access to the data of the employees they manage.
Streamlining Internal Data Sharing
Rather than creating a dashboard using a personalized data source for each employee, then sharing access to this dashboard with others one-by-one, Media.Monks set out to create one dashboard with a data source that contains all required data and shares it in a way that gives access to a group of specified people. The proposed solution is based on BigQuery’s capability to use nested fields, enhanced further by using Google Sheets for simplified access management.
The example below provides maps between owners of business units and managers of varying levels. Thanks to this mapping, a direct manager can access the data of any employees sitting beneath them in the report, as well as a person who sits two layers up in the organizational structure.
First, it is important to correctly map out who should have access to which part of the data set using a Google Sheet. This might vary depending on the data in question, and should be carefully considered before sharing the final dashboard.
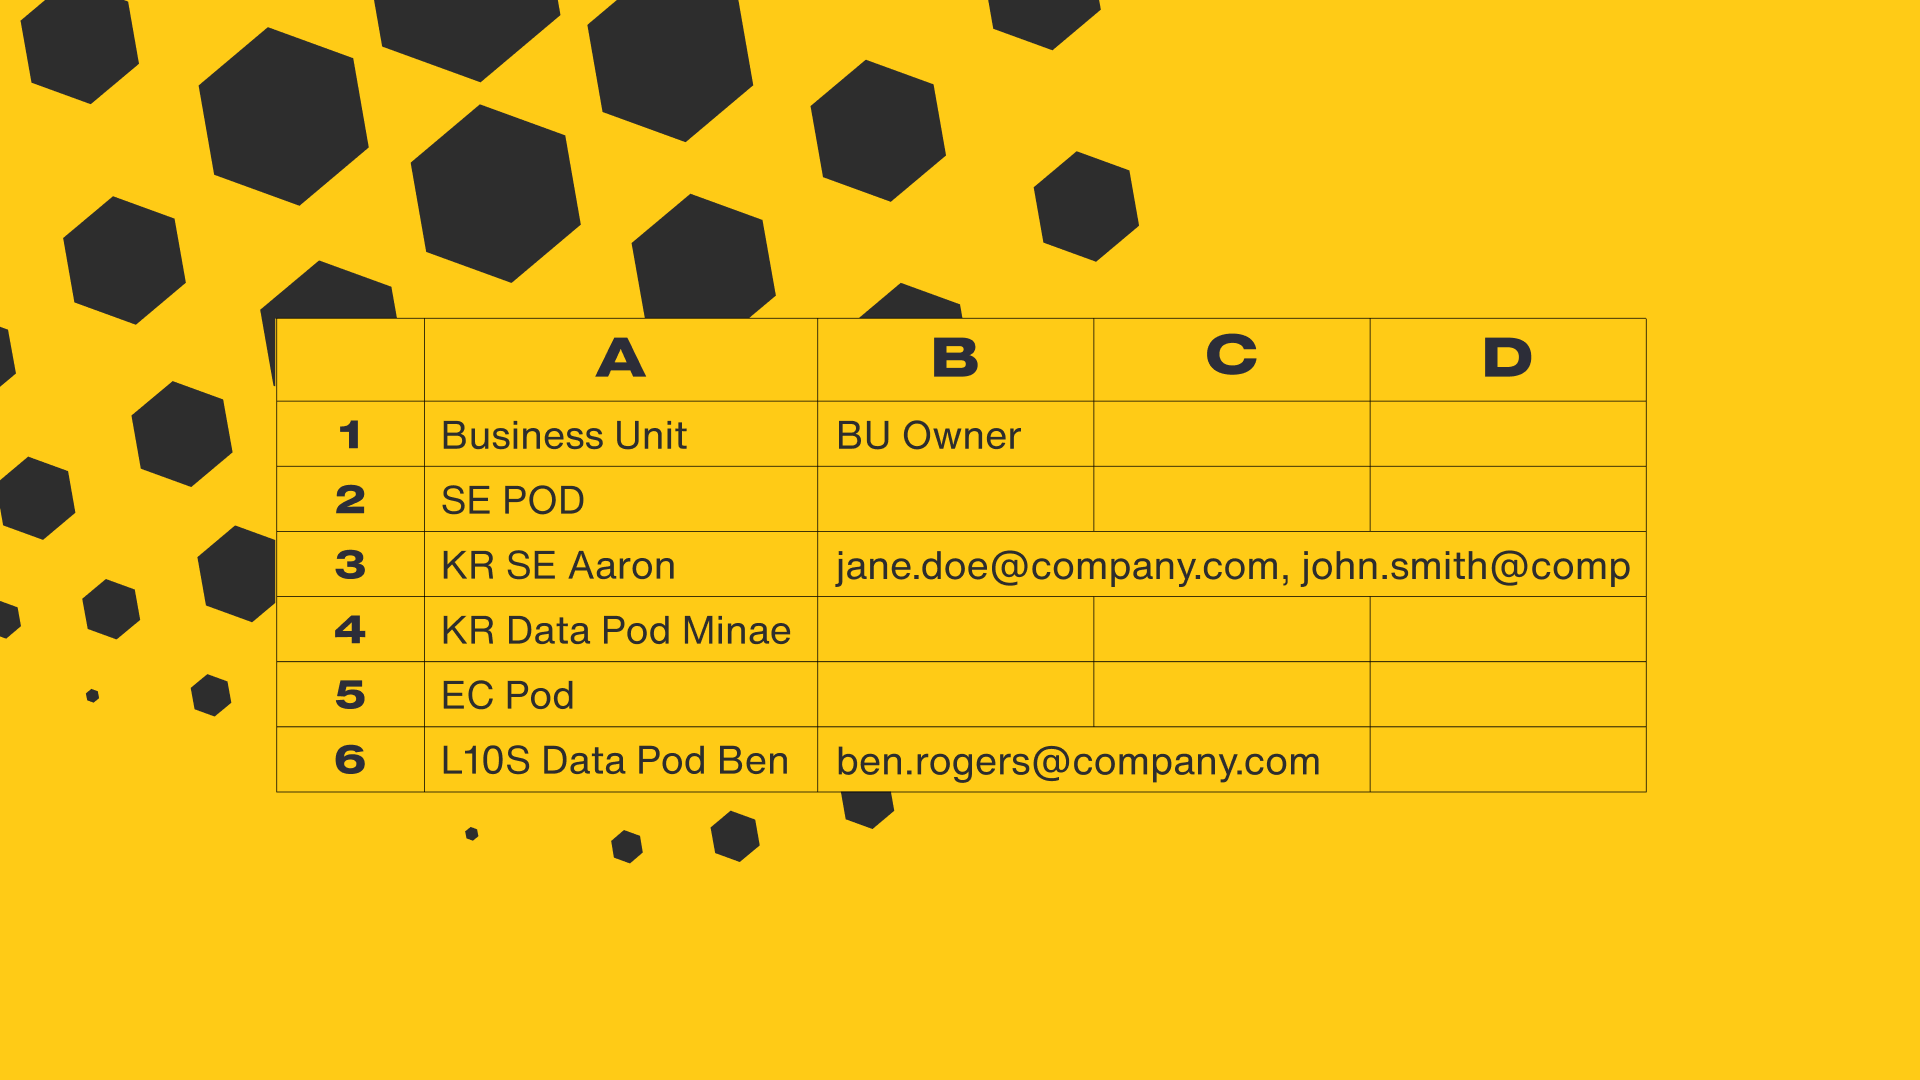
Example mapping between business units and people who may have access to the data.
Looking back at the example, ‘Business Unit Name’ was identified as a mapping field between the data source being used and the access management sheet. The ‘BU Owner’ field is used to list all email addresses of people who shall have access to the data. ‘BU Owner’ will become the email field when setting up an email filter. What is particularly interesting about this solution is that any updates to permissions made via the access management sheet will work in real time.
A few technical steps remain to put the solution together. The access management/permission sheet needs to be linked to BigQuery. Data transformation is also required in order to create a nested field (array) out of the provided email addresses, which is achieved with an SQL function “split”: SELECT bu_name, split(trim(bu_owner), “ , “ ) bu_owner FROM *Insert Data Source*
The result shows each team/Business Unit name, along with the corresponding emails of the users that have access to that team’s data, like this:
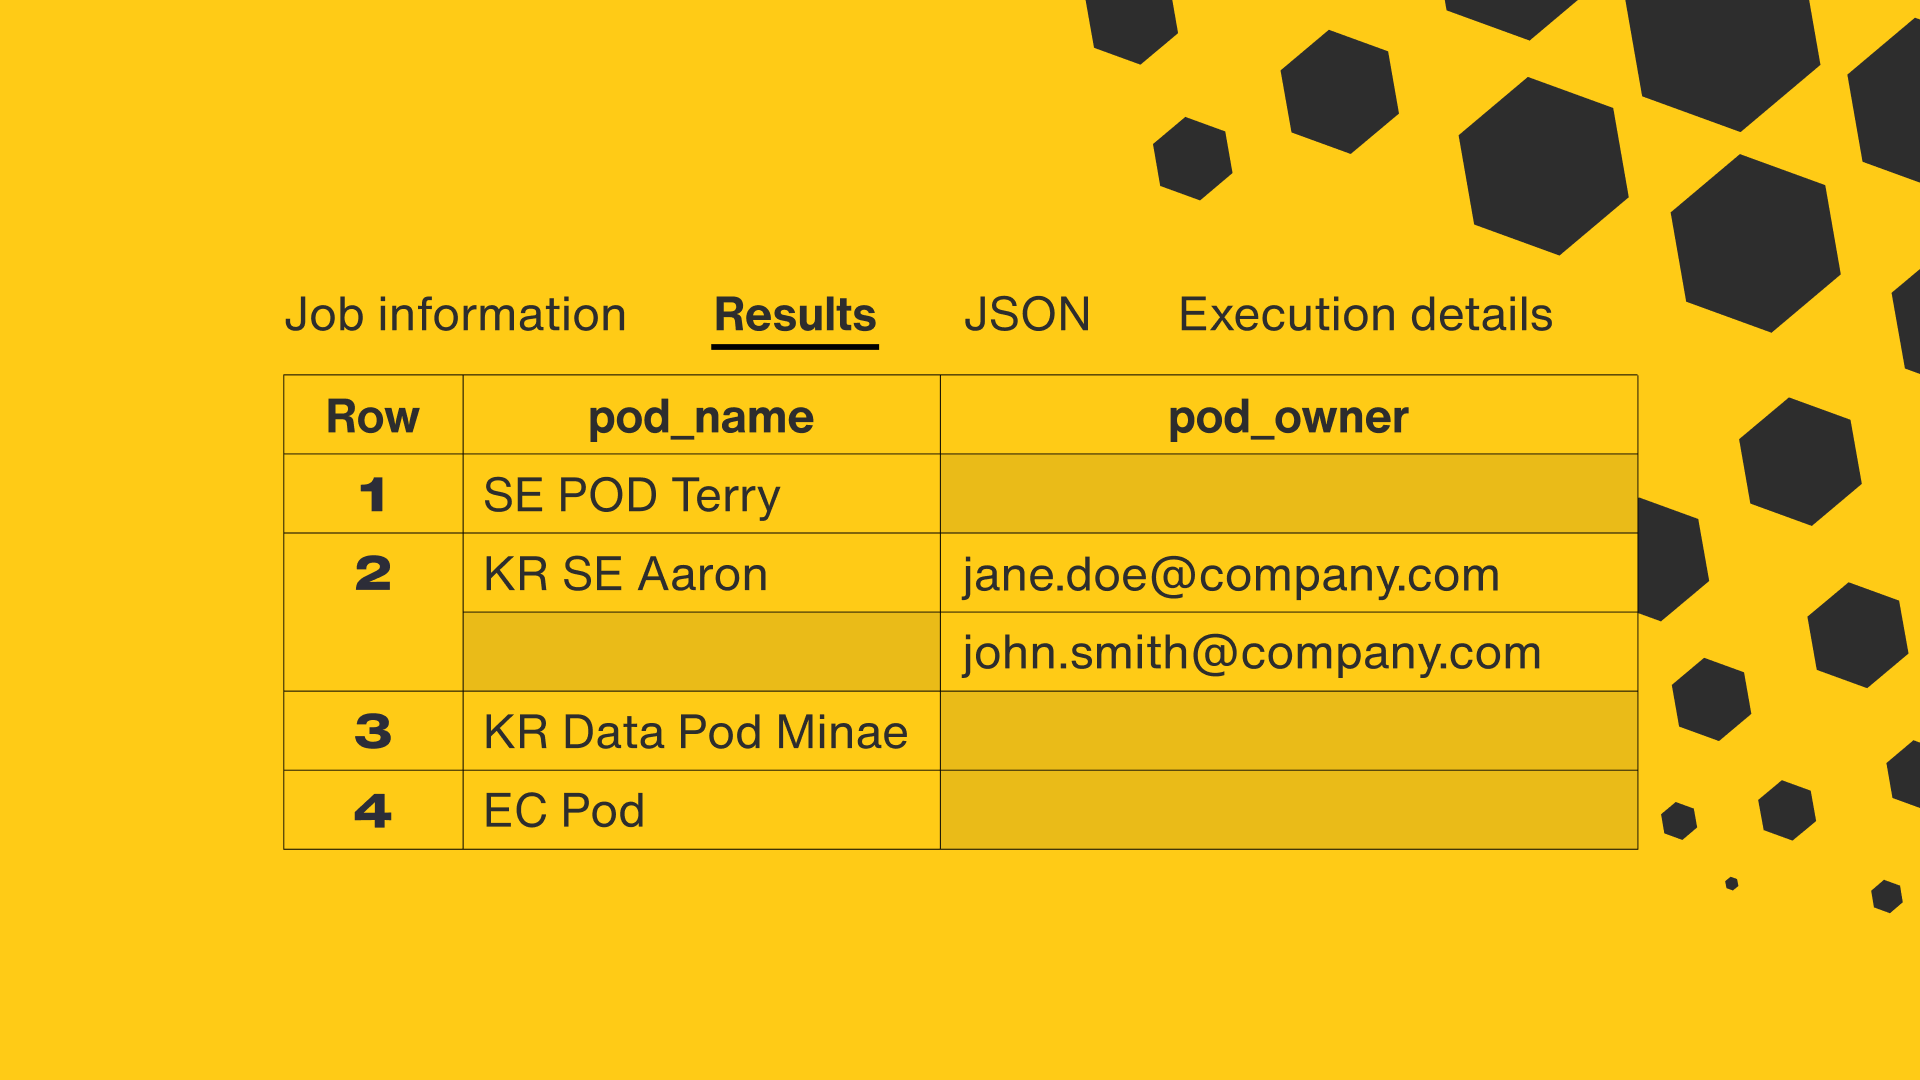
Query results based on data from Google Sheets.
The last step here is to join the original data source with the table representing the Google Sheet, then save it either as a view or a table. For more complex queries and situations it is advised to save the results as a table, which improves performance. Some further tweaks may be required to increase performance and leverage BigQuery’s BI engine.
The logical principle here is that only a single user may access the dashboard at any point in time. The advantage, however, is that when the Business Unit Owner field gets ignored, the data maintains its consistency, as there are no row multiplications.
The dashboard is then connected to BigQuery’s destination entity. In the Data Studio UI, the owner of the data source must enable the email address filter feature and appoint ‘BU Owner’ as the filtering field. If you need to make changes to who can have access to another person's data, you only need to do so in the access management sheet, as they will be reflected in the connected data source instantly.
Toward Efficient Practices for Handling Data Internally
Sharing sensitive data with the right people, particularly in a multi-level organization, is a process that should be undertaken with utmost precaution. How people at different levels apply data to the business depends on their attitude to data—ranging from a core driver of the business to a point of annoyance and confusion—underscoring the importance of making data accessible and comprehensible to all who use it. By augmenting data visualization and securely sharing the most relevant data to members of the team, it’s only a matter of time when data becomes the priority. I eagerly wait for that day.
Related
Thinking


Sharpen your edge in a world that won't wait
Sign up to get email updates with actionable insights, cutting-edge research and proven strategies.
Monks needs the contact information you provide to us to contact you about our products and services. You may unsubscribe from these communications at any time. For information on how to unsubscribe, as well as our privacy practices and commitment to protecting your privacy, please review our Privacy Policy.